Know your neighborhood.
Grow your future.
AI-powered urban resilience insights that help communities understand and fight extreme heat—block by block.

- Plant street trees along the hottest corridors
- Replace surface parking lots with permeable paving
- Add green roofs to large new buildings
Intelligence for every
block, park, and street.
Real satellite data, turned into resilience plans planners, residents, and developers can act on today.
Heat Island Mapping
Real NASA MODIS surface-temperature imagery shows where the urban heat island runs hottest.
Tree Canopy Intelligence
OpenStreetMap's mapped trees, parks, and woodland reveal canopy gaps, then match climate-fit species to each street.
Cooling Corridor Design
Find where new green space, shade, and permeable surfaces will cool dense blocks the most.
Real data. Open and verifiable.
Every source is public and free to inspect. Open any of them to see exactly what CanopyIQ builds on.
The right tree for
every street.
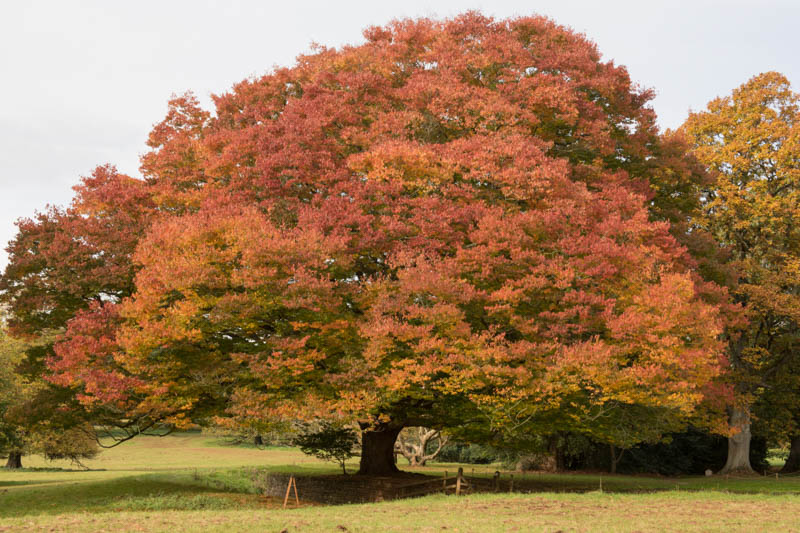
CanopyIQ matches climate-appropriate, high-impact tree species to your USDA hardiness zone and local conditions, so every planting suggestion fits the street it is meant for.
:max_bytes(150000):strip_icc()/magnolia-grandiflora-growing-guide-5200996-hero-65ba587077754209bb926f063d2fe6fa.jpg)

Trees are infrastructure.
Every tree planted in an urban heat island delivers measurable environmental and economic returns to its community.
Figures reflect published urban-forestry research, shown for context.
Three steps. Fully transparent.
Enter an address, let the model read your block, and get a plan you can act on. No black box.
Enter your address
Any address, ZIP, or neighborhood. CanopyIQ pulls live data for that exact spot.
AI analyzes your block
Heat, canopy, surfaces, and air combine into a resilience score in seconds.

Receive your resilience plan
A prioritized, costed action plan with projected cooling, ready to export.
Hover any step to see what it does. Every number is traceable to an open data source.
Don't just measure.
Take action.
Every analysis opens a Community Action Center that turns findings into ready-to-send plans.
Green infrastructure
pays for itself.
Urban trees and green spaces deliver measurable returns across health, climate, energy, and ecology.
Figures reflect published urban-forestry research, shown for context.
Each urban tree sequesters an average of 21 kg of carbon annually while filtering particulates and ozone.
A single mature tree intercepts up to 380 liters of rainfall per year, reducing runoff and sewer overflows.
Diverse urban canopies support native pollinators, birds, and invertebrates critical to healthy ecosystems.
Dense canopy corridors can reduce fine particulate matter concentrations by up to 13% in downwind areas.
Strategic shade tree placement can reduce household cooling costs by up to $350 annually per property.
Green space access is correlated with 26% higher rates of reported wellbeing in urban communities.
Most climate tools stop at identifying problems. CanopyIQ helps communities understand them, simulate solutions, and take meaningful action.